MUTATE: IN SILICO PERFORMANCE OF THE FLUCTUATION TEST

Hints
- After download Mutate requires the Java 5.0 (or higher) Runtime Environment freely available at http://www.java.com.
- Whatever the operating system, you should be able to run the program just by double clicking on the mutate.jar file
- WINDOWS USERS: If double-clicking the .jar file does not open the program, make sure that the jar extension is associated with javaw.exe (in your JRE folder).
Contact
For any questions you can contact me
Return to AC-R home
Example
Nowadays we know a candidate gene for the E coli resistance to T1.
This is the fhuA gene which is responsible for E coli membrane receptor of T1.
It is supposed that deletion in this E. coli gene provokes T1 resistance (Killman et al 1996; Langescheid et al 2004).
For ease we will introduce the simplifying assumption that a point mutation generating a stop codon is provoking the
resistance effect. Therefore, the first step of the practice is to connect from the adequate menu of the Mutate program to one of the databases (NCBI or EcoGene),
then search for the cDNA of the E. coli fhuA gene and download it for at least five different E. coli strains.
The sequences should be stored in a file under Fasta format that will be used in the next step.
Secondly, the students must open the file with the sequences and go to the aminoacid (AAs) tab to decide about the adequate reading frame.
Once the adequate reading frame is detected the student will be asked to manually introduce, by editing the sequence table in the DNA panel,
at least one stop codon mutation.
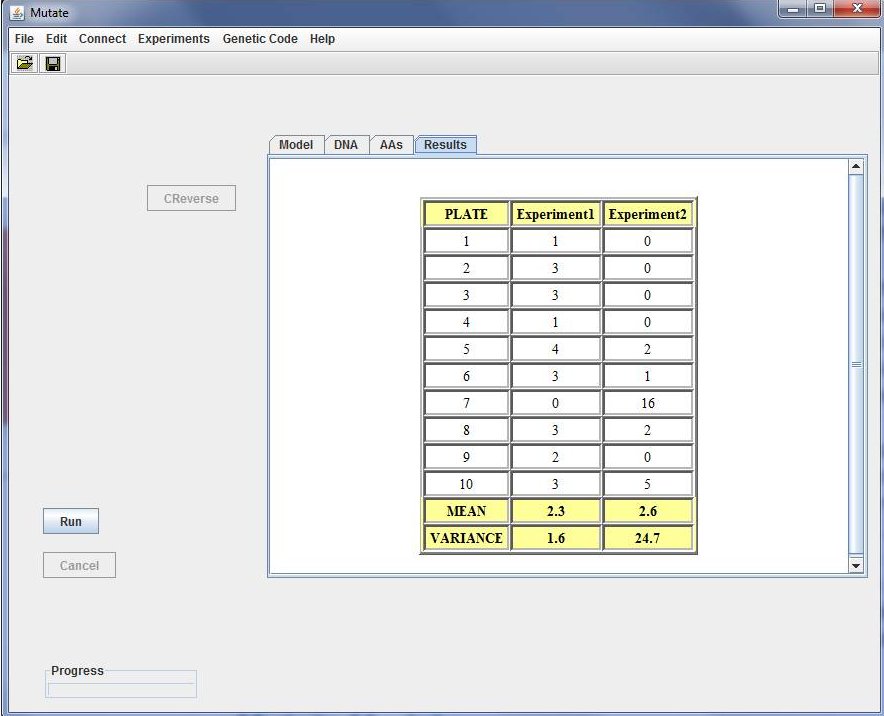
After doing this, the experiment can be launched via the run bottom.
Now the student is suggested to try different experimental settings and obtain adequate conclusions.
For example, compare cases:
a) E1: N = 106, µ = 10-8, P = 10. E2: N = 105, µ = 10-8, P = 10.

b) E1: N = 107, µ = 10-8, P = 10. E2: N = 106, µ = 10-8, P = 10.

c) E1: N = 108, µ = 10-8, P = 10. E2: N = 107, µ = 10-8, P = 10.

d) E1: N = 109, µ = 10-8, P = 10. E2: N = 108, µ = 10-8, P = 10.

e) 10E1: N = 109, µ = 10-8, P = 10. 10E2: N = 108, µ = 10-8, P = 10.

f) 100E1: N = 109, µ = 10-8, P = 10. 100E2: N = 108, µ = 10-8, P = 10.

g) 200E1: N = 109, µ = 10-8, P = 10. 200E2: N = 108, µ = 10-8, P = 10.

h) E1: N = 108, µ = 10-8, P = 5. E2: N = 107, µ = 10-8, P = 5.

i) E1: N = 108, µ = 10-8, P = 50. E2: N = 107, µ = 10-8, P = 50.
Explain the obtained results. What hypothesis, adaptative or preadaptative, is better supported by the data?. What happens when increasing the number P of plates and/or the experiment replicates?. Please, note that the number appearing before the experiment identifier i.e. as in 10E1, refers to the number of experiment repetitions or replicates. That is, E1 stands for the results of performing the experiment-1 just one time while 10E1 refers to results averaged through 10 experiment replicates. Assuming that mutation ocurrence follows a Poisson distribution, estimate the mutation rate µ from the E2 experiment of case d) as
µ = m / (Nt - N0).
Note that the expected number of mutations m that occurred per plate can be computed from the proportion p of cultures without mutants, being
p = e-m
A. Carvajal-Rodriguez - Departamento de Bioquímica Genética e Inmunología - Universidad de Vigo.
( Last update: December 2011)